2020 By the Numbers
According to the 2020 U.S. Census, Dutchtown proper is home to 15,356 residents. Measuring the Greater Dutchtown area, including Gravois Park (4,683), Mount Pleasant (4,376), and Marine Villa (2,530), the total population of the area is 26,945. Though the neighborhood lost some residents between the 2010 and 2020 Censuses, the losses trended much lower than the City of St. Louis overall.
The neighborhood is majority Black, with approximately 51% of Greater Dutchtown neighbors identifying themselves as such. Whites make up about 28% of Greater Dutchtown’s population. 5% overall identify as Asian, with Asian neighbors particularly clustered in Dutchtown proper. 8% identify as two or more races, and 7% as another race. Just over 11% of Dutchtown neighbors identify as Hispanic or Latino.
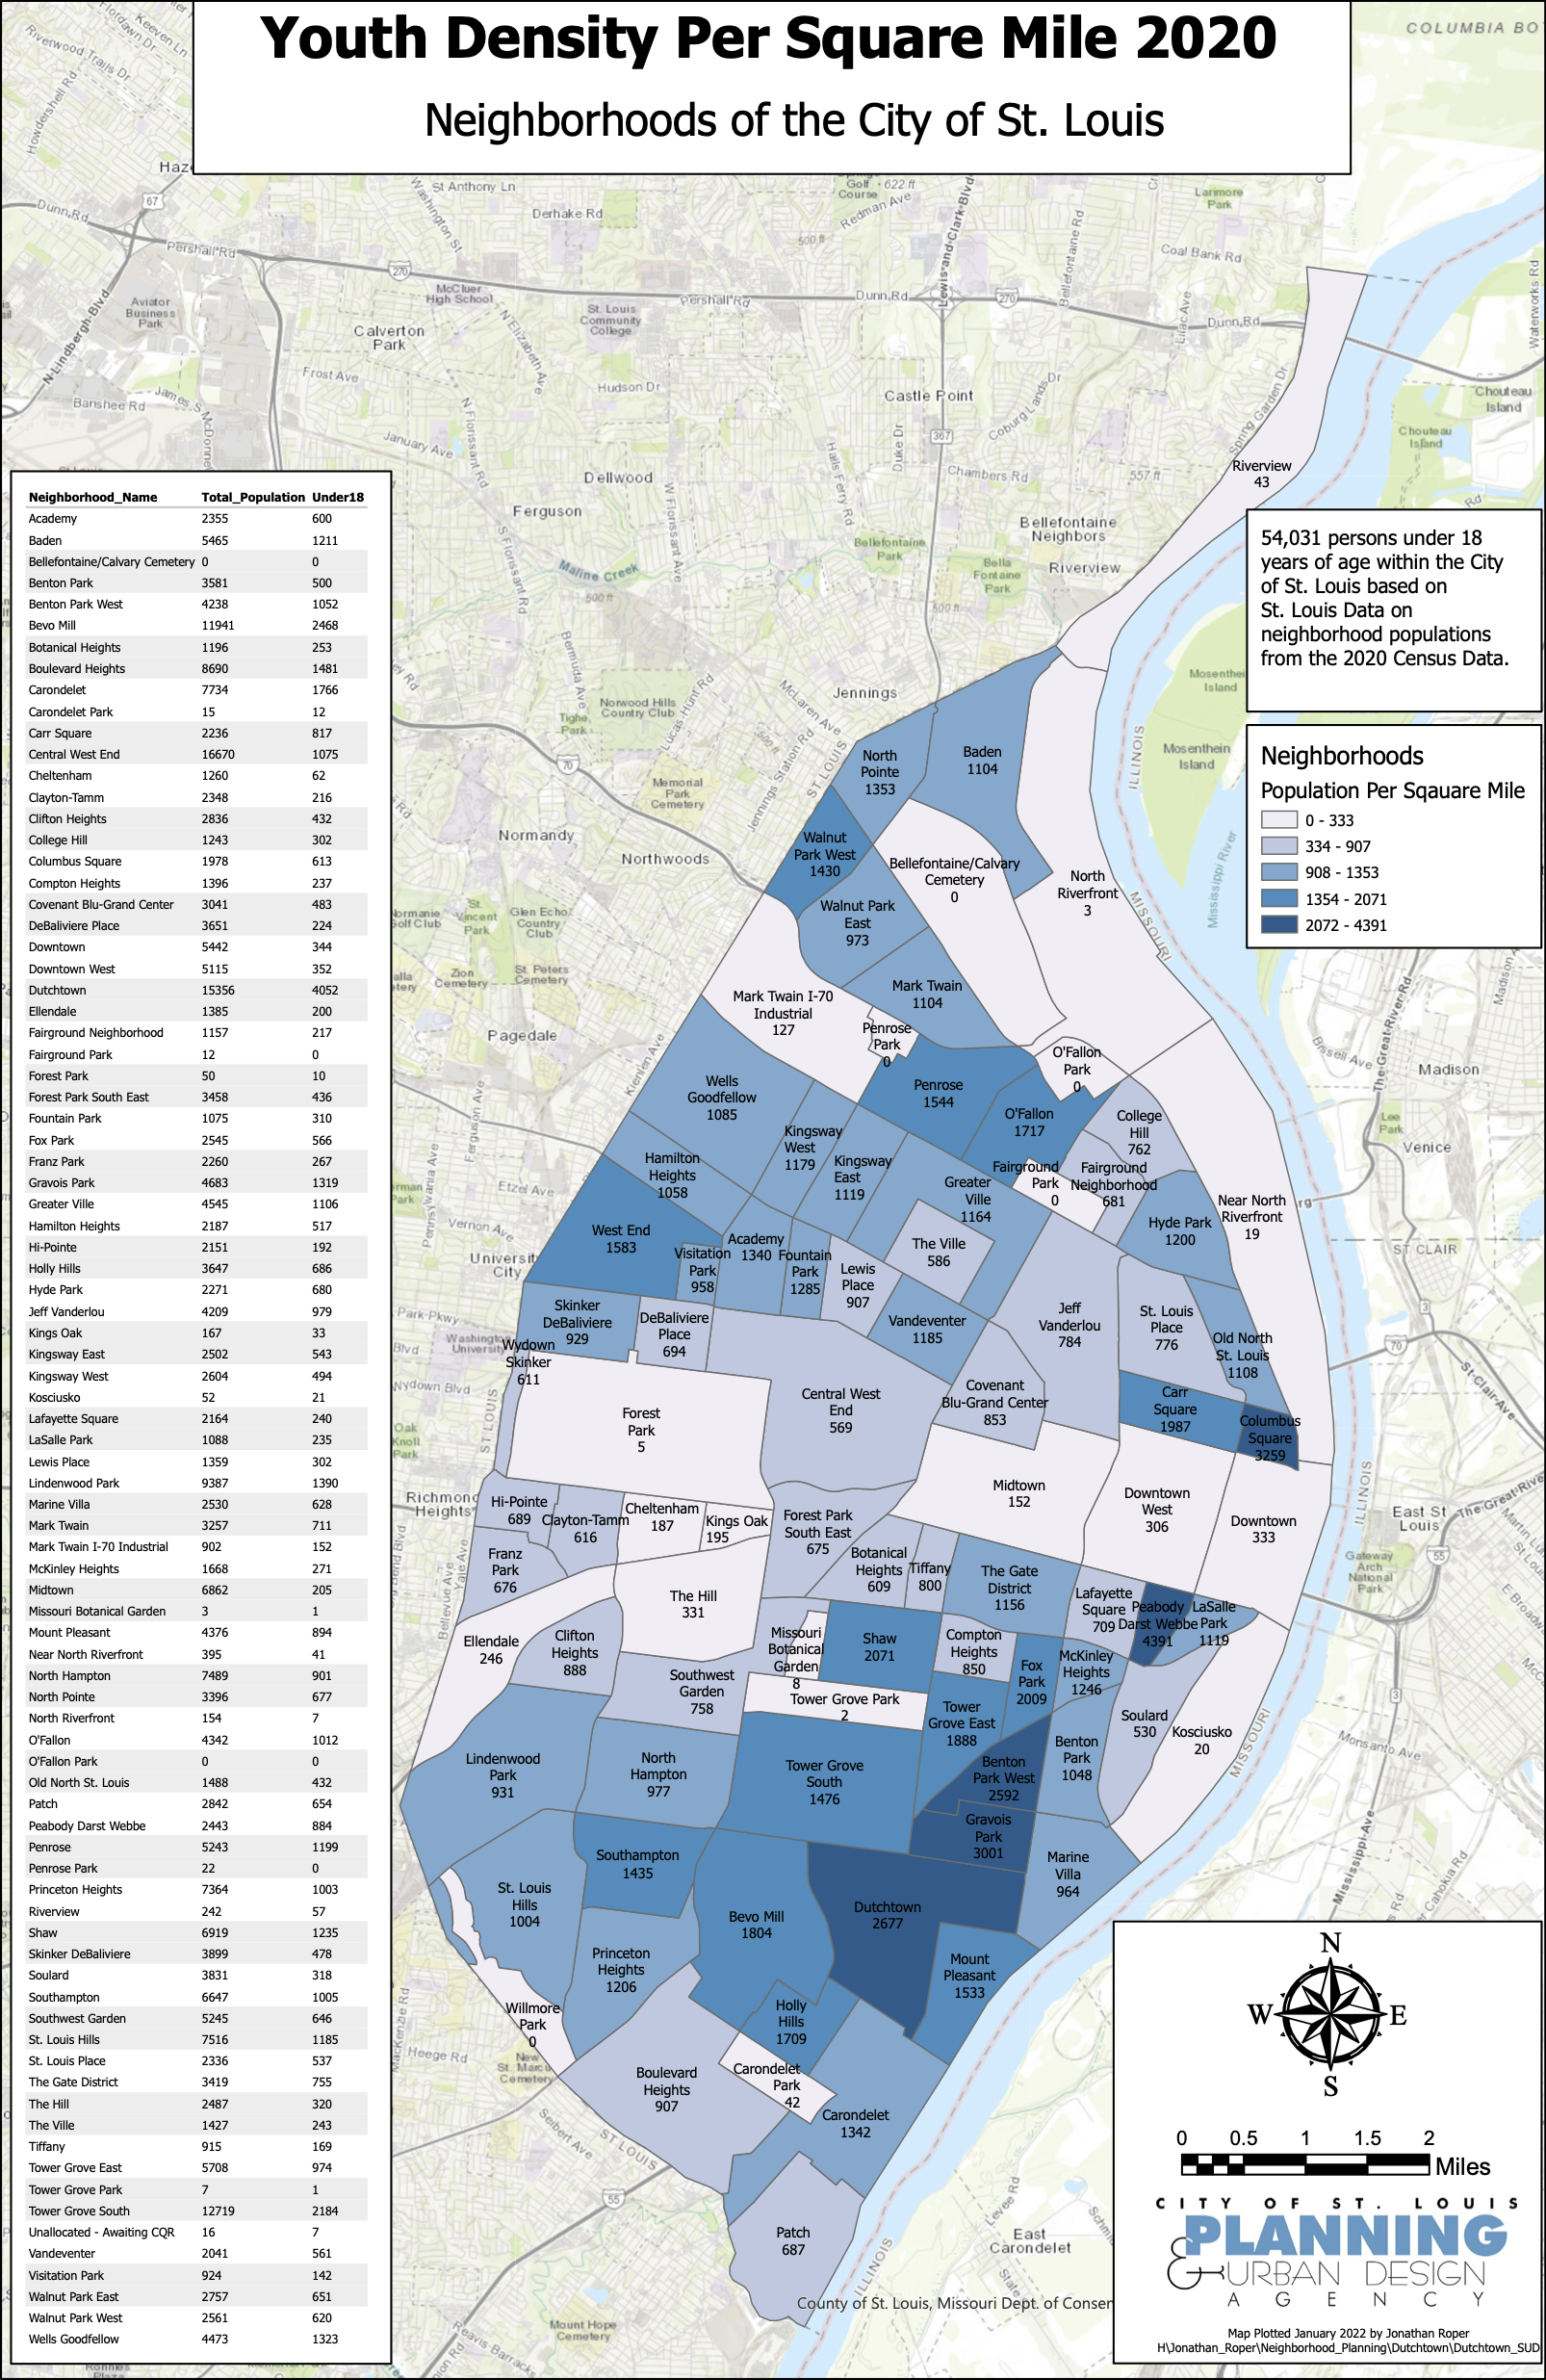
Over 25% of the neighborhood’s population is under the age of 18. Dutchtown’s youth population is extremely high compared to many other parts of the city, particularly among the areas south of Interstate 44.
Although Dutchtown struggles with vacancy—roughly 25% of housing units are unoccupied—the neighborhood is still among the densest in St. Louis. Dutchtown proper and Gravois Park have densities of over 10,000 residents per square mile. Adding in the Mount Pleasant and Marine Villa neighborhoods, which contain significant industrial property and other non-residential uses, the population density is still an impressive 8,400 people per square mile.
These figures are sourced from the City of St. Louis website.
Dutchtown Demographics Over the Years
Like any urban neighborhood, Dutchtown has seen drastic demographic shifts over the last 150 years. Let’s take a look at the demographics of Dutchtown from its days as a rural outpost to the present.
Early History: The Middle of Nowhere
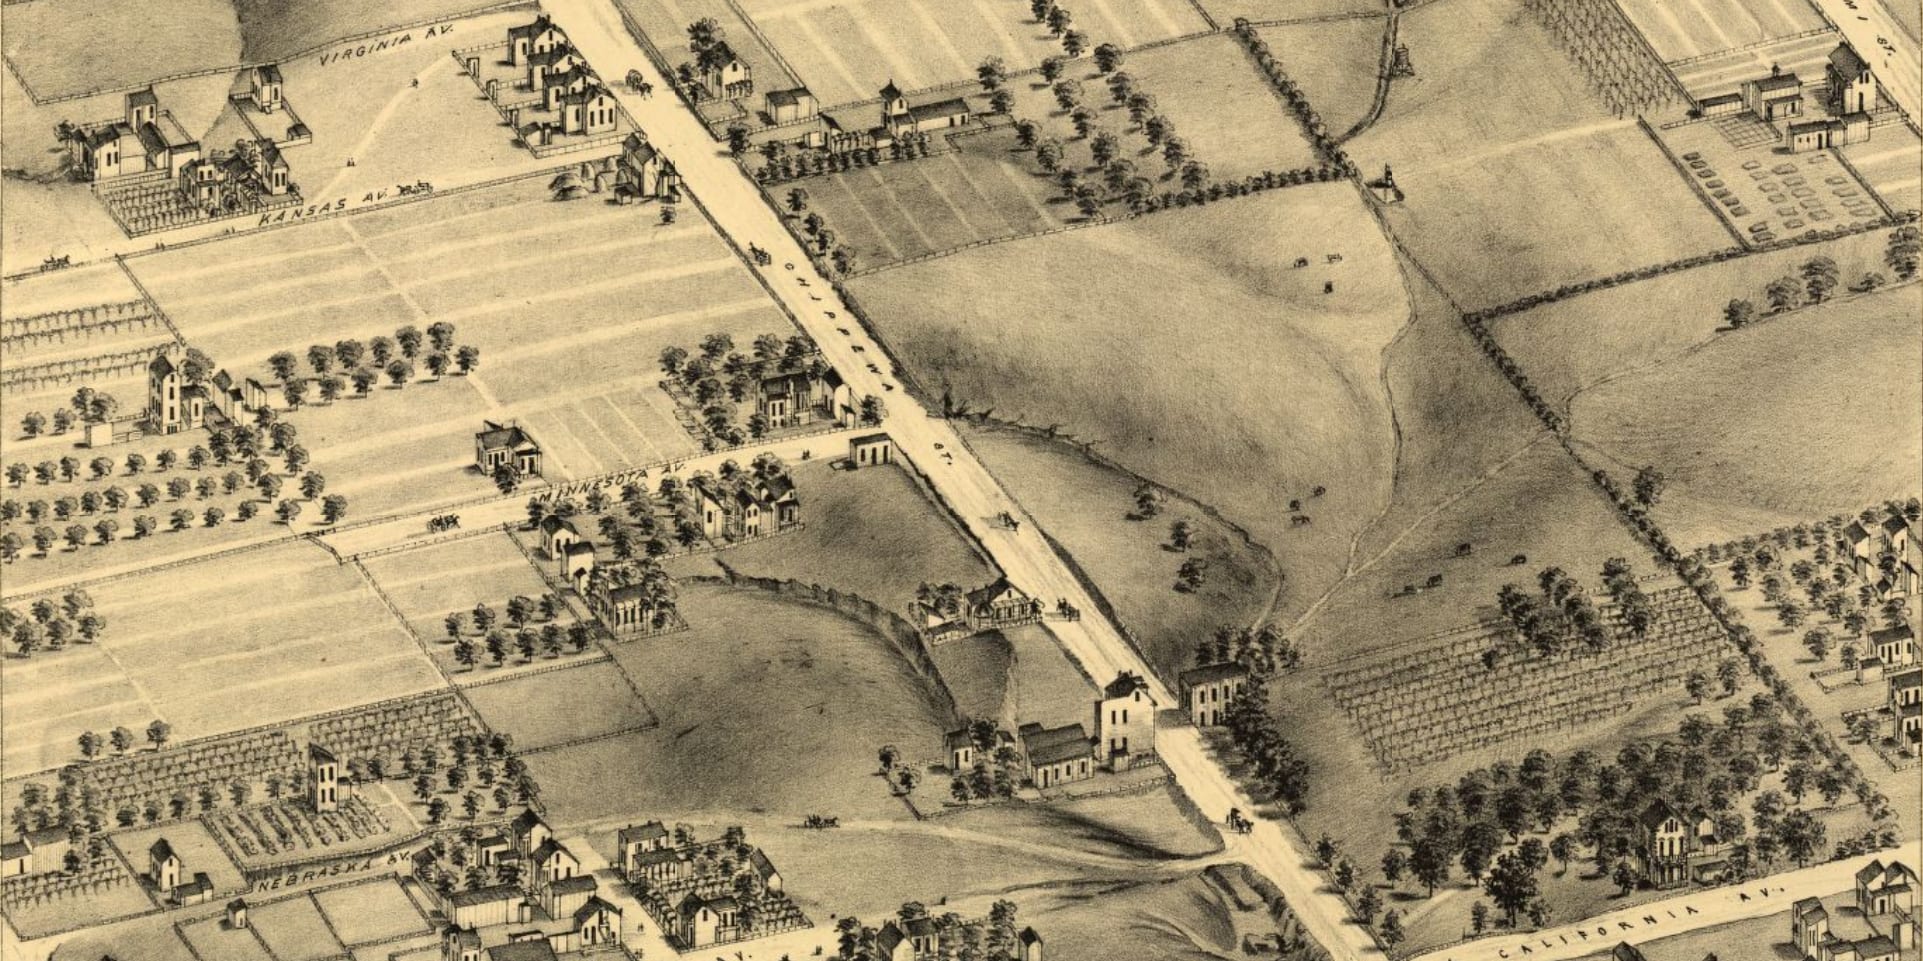
Before it was known as Dutchtown, the area was part of the common fields of St. Louis to the north and Carondelet to the south. Very little development had taken place between the two towns prior to the Civil War. Carondelet Road, now South Broadway, connected St. Louis and Carondelet by way of Dutchtown.
The parish of St. Anthony of Padua was established in 1860. Prior to building their first church on Meramec Street in 1864, parishioners held services at the House of Refuge, an orphanage on the land that would become Marquette Park. The congregation in the early 1860s was composed of 70 German-speaking families and 25 English-speaking families, with 117 school-aged children between them.
Rapid Growth: The Germans Arrive
St. Louis extended its borders with the annexation of Carondelet (and everything in between) in 1870. The common fields were divided and platted for development. Soon, German immigrants began to flock to the newly opened southeast sections of the expanded city. The Germans, or Deutsche, planted roots and thrived in the area for many decades. The name “Dutchtown” comes from the word Deutsche.
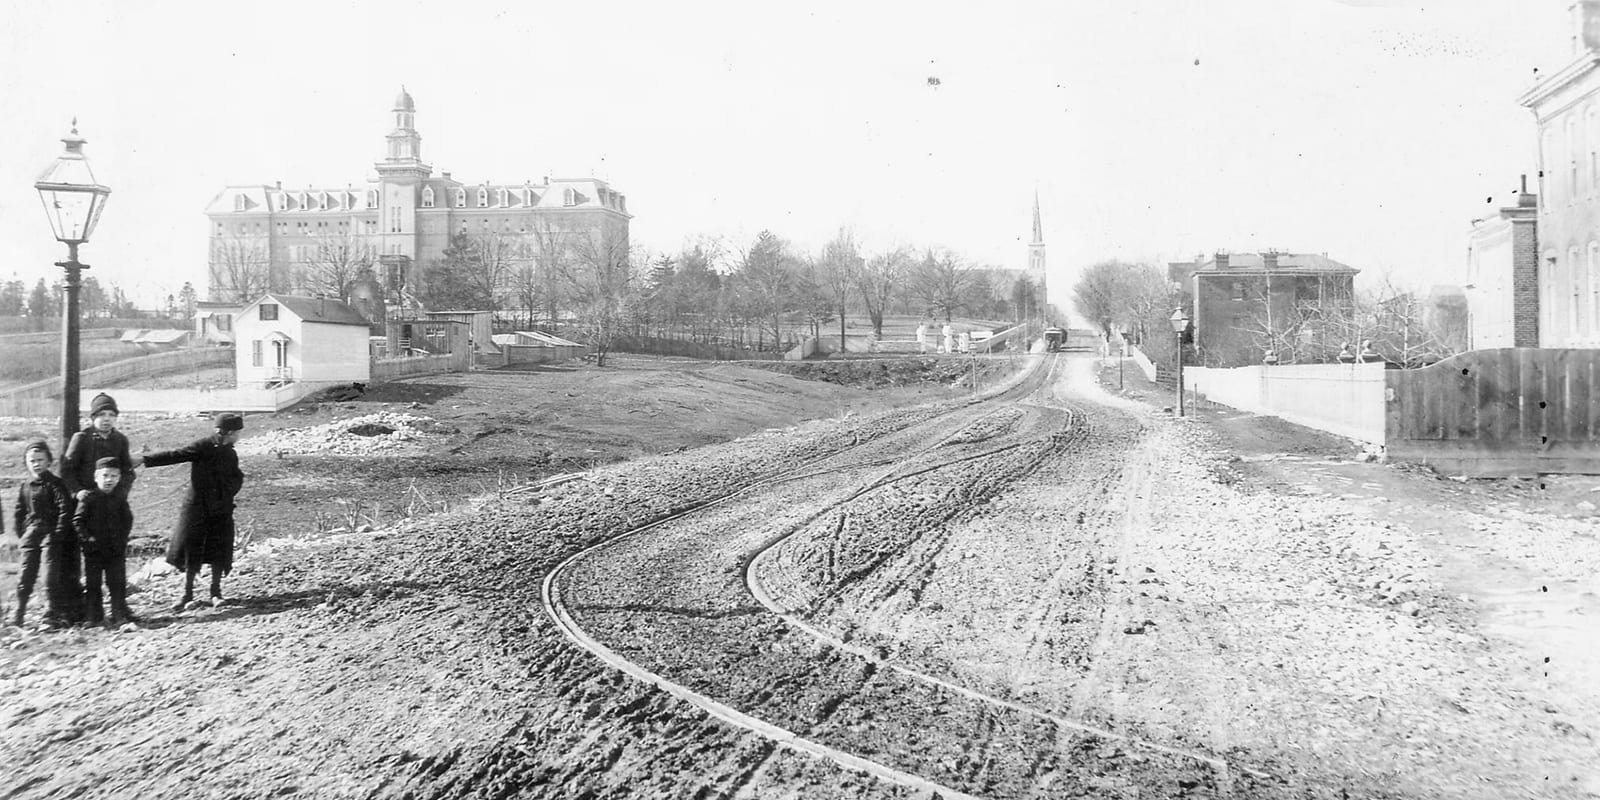
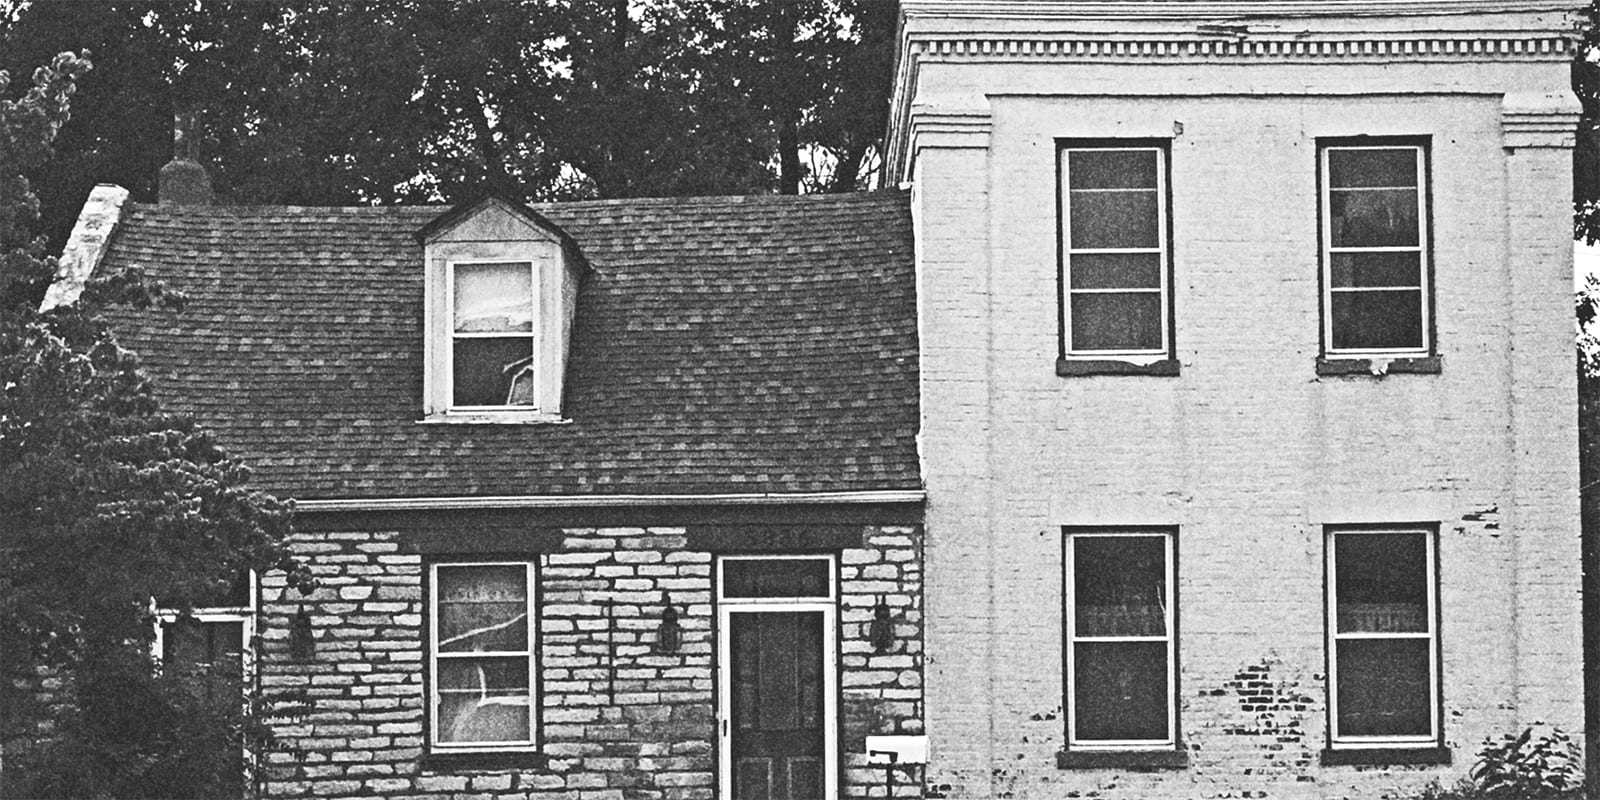
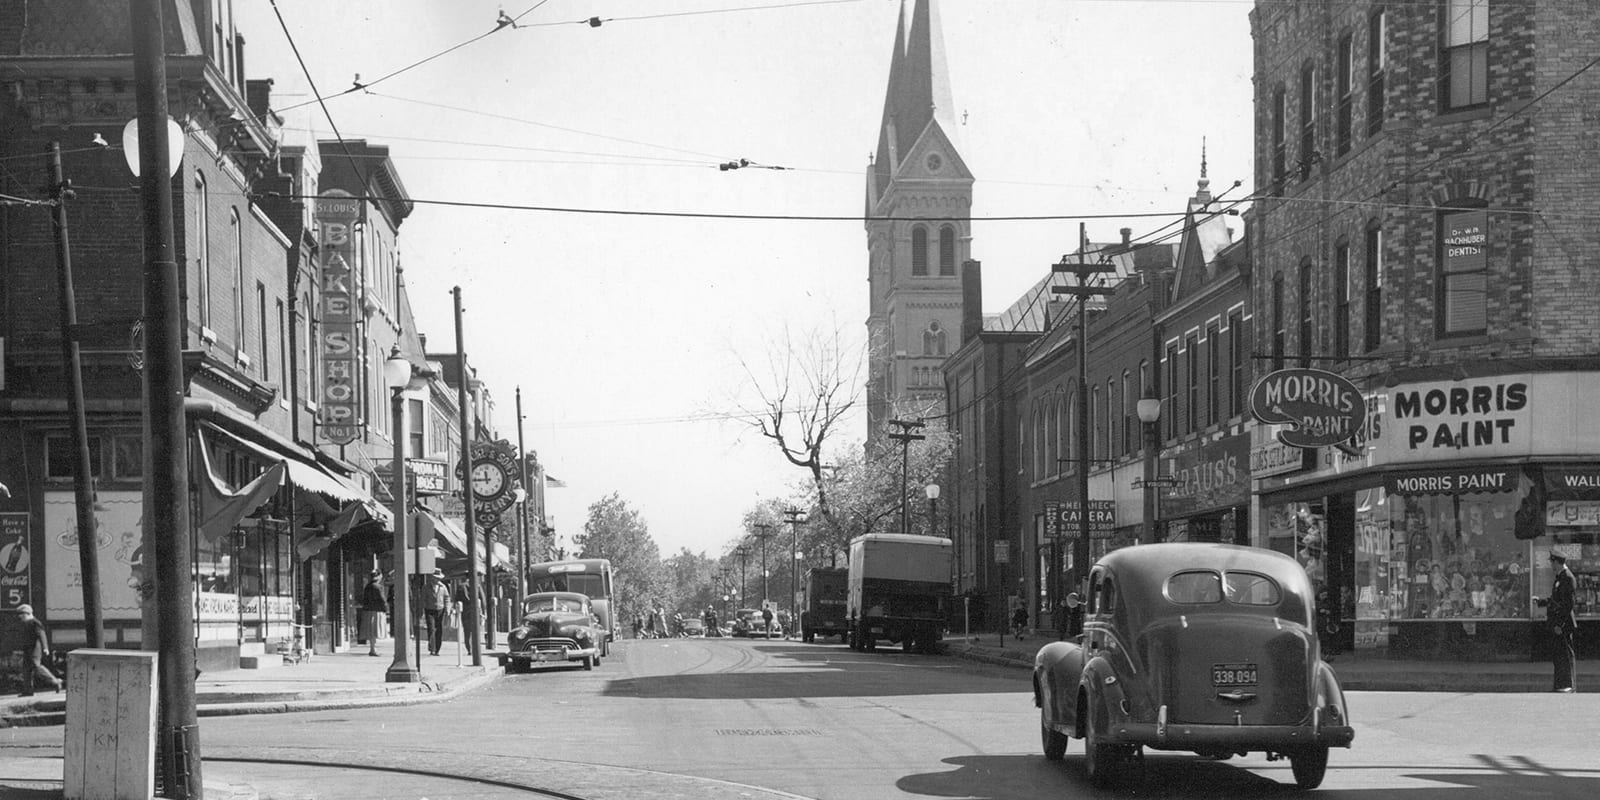
Between 1880 and 1920, Dutchtown grew quite rapidly. The neighborhood quickly shed its rural character as sturdy brick homes and shops popped up around newly built streetcar lines. Most of the buildings still standing in Dutchtown today were built during this period.
The neighborhood continued to grow and flourish through the 1950s. Unfortunately, things would soon begin to take a turn in Dutchtown, St. Louis as a whole, and in urban centers across America.
Mid-Century Changes: Suburban Exodus
The post-World War II era brought massive changes to the way Americans lived, and Dutchtown was certainly touched by those changes.
After the war, young men returned home looking to start families. The G.I. Bill incentivized young families to purchase homes in newly developing suburbs on the outskirts of the city. The suburbs grew at a breakneck pace.
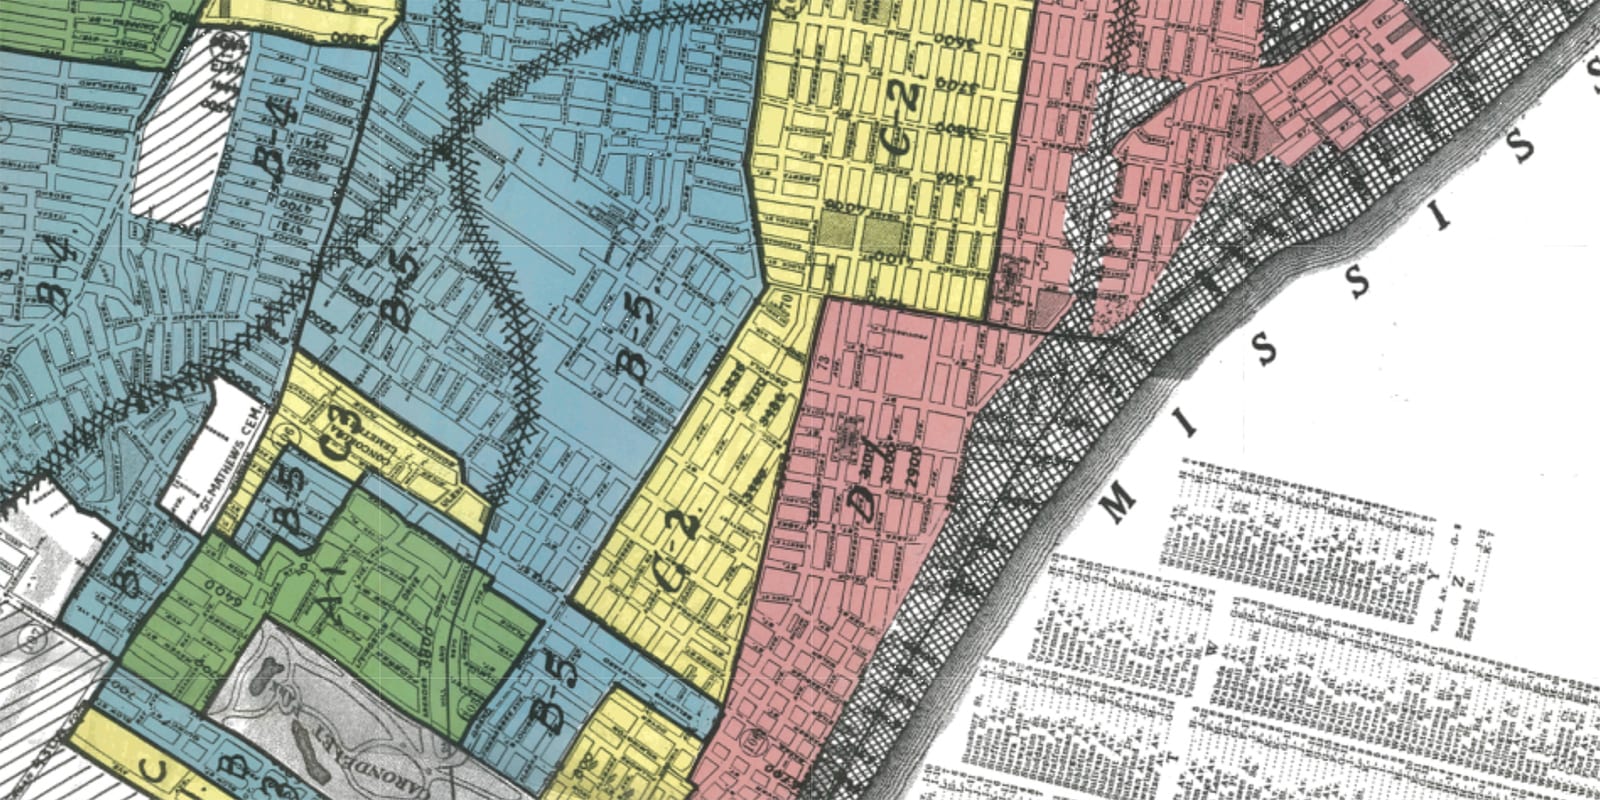
If the incentives weren’t enough, mortgage redlining by banks made it difficult for those who wanted to stay. Bankers hesitated to issue loans on homes in the neighborhood, particularly in the older eastern sections of the neighborhood.
The construction of the Interstate Highway system accelerated the flight to the suburbs. In the 1960s Interstate 55 slashed indiscriminately through the eastern portion of Dutchtown, demolishing homes, uprooting neighbors, and disconnecting east and west. Auto-centric development wrested business from neighborhood commercial districts along streetcar lines, and soon the streetcars themselves disappeared.
Late 20th Century: The South Side Diversifies
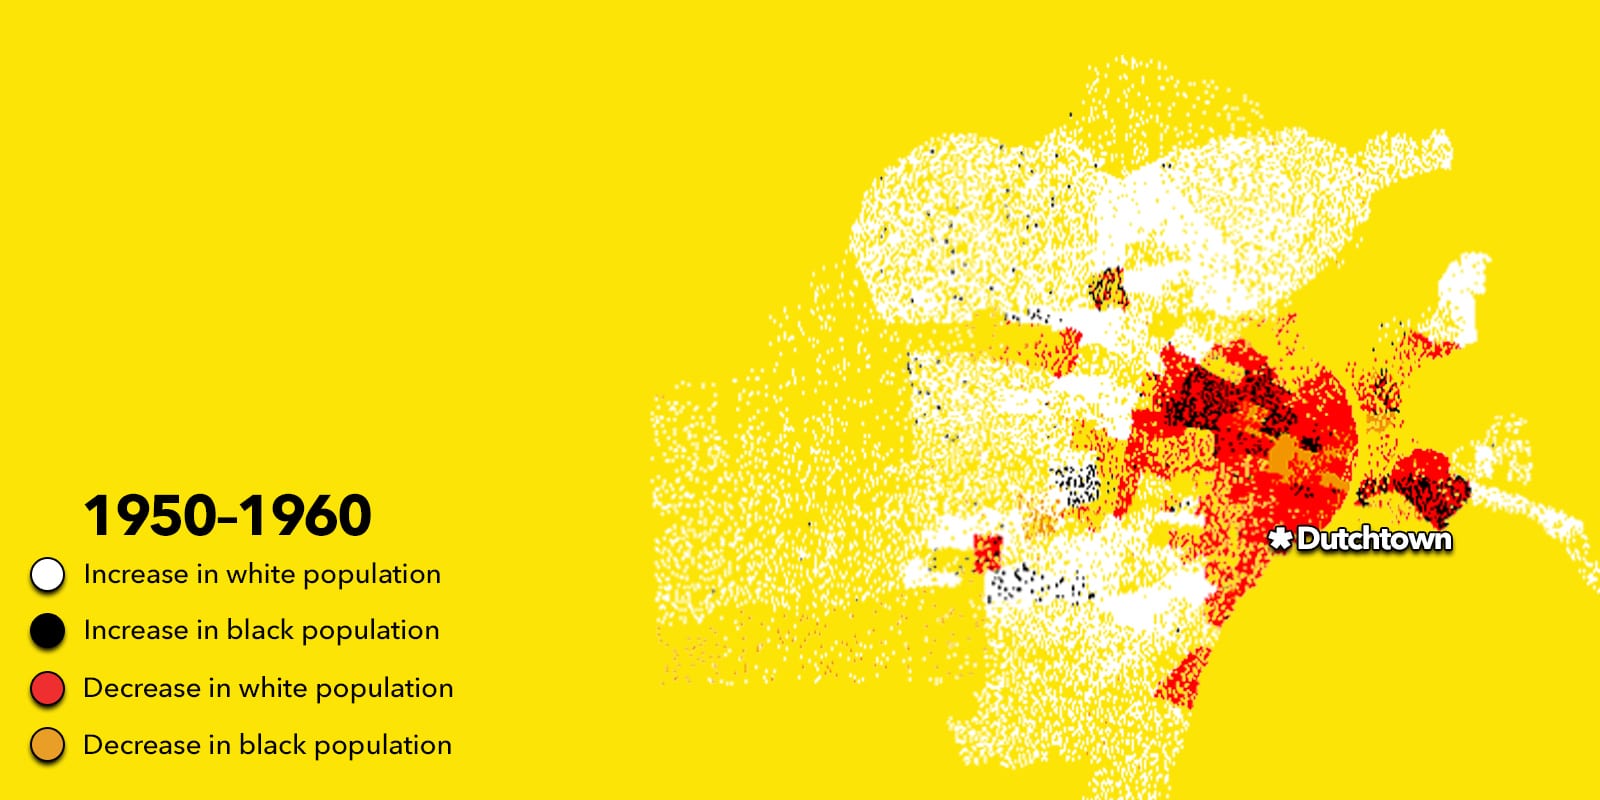
Following the fights for civil rights in the 1960s, people of color had more options as to where to live in the city. Previously relegated to the near North Side or the Mill Creek Valley area, Black people began to spread out into other parts of the city (though not always by choice, but rather through displacement by so-called urban renewal).
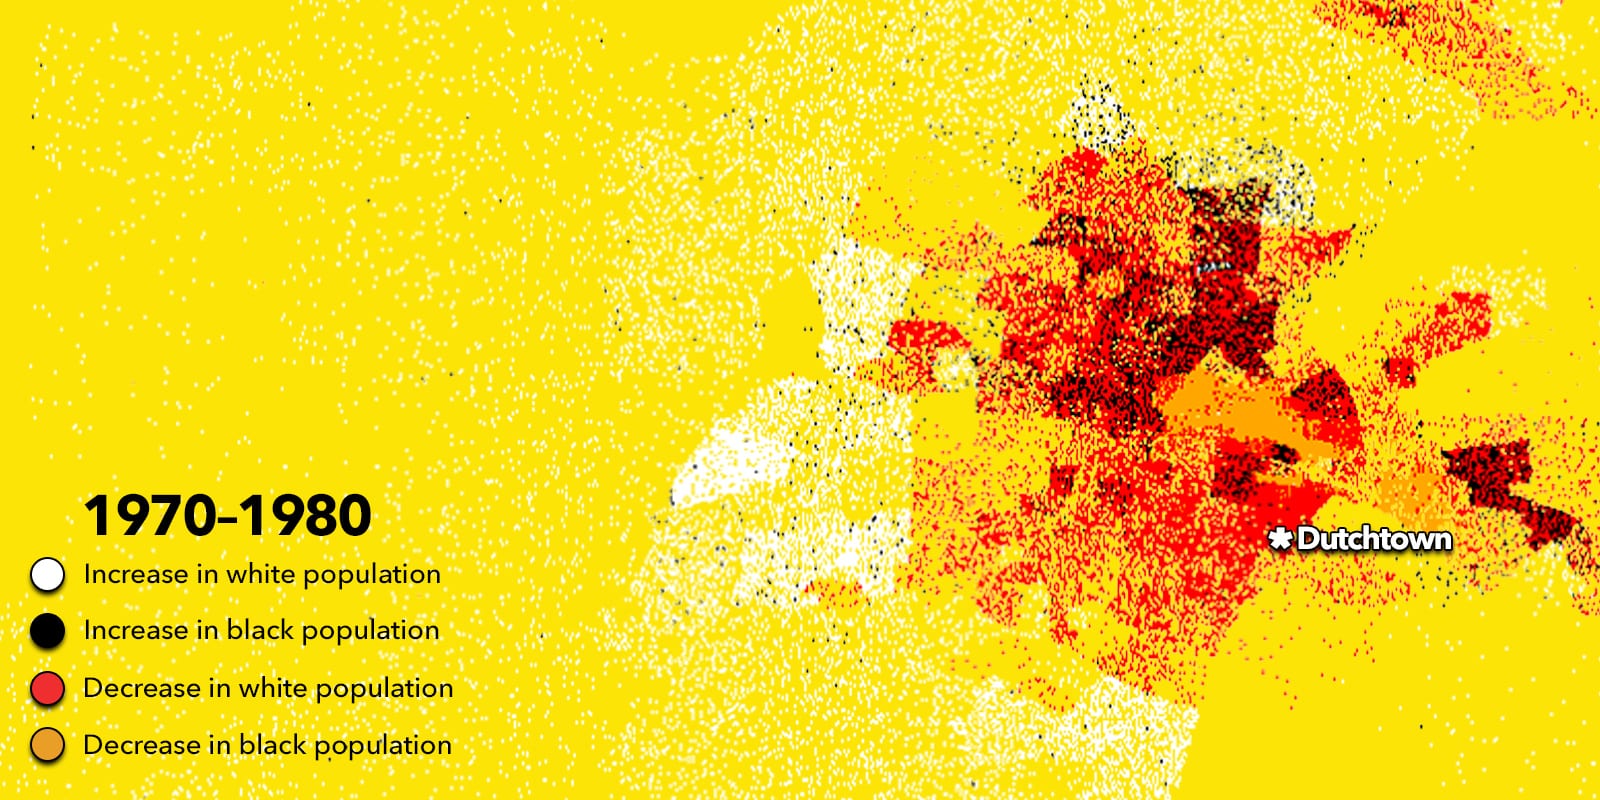
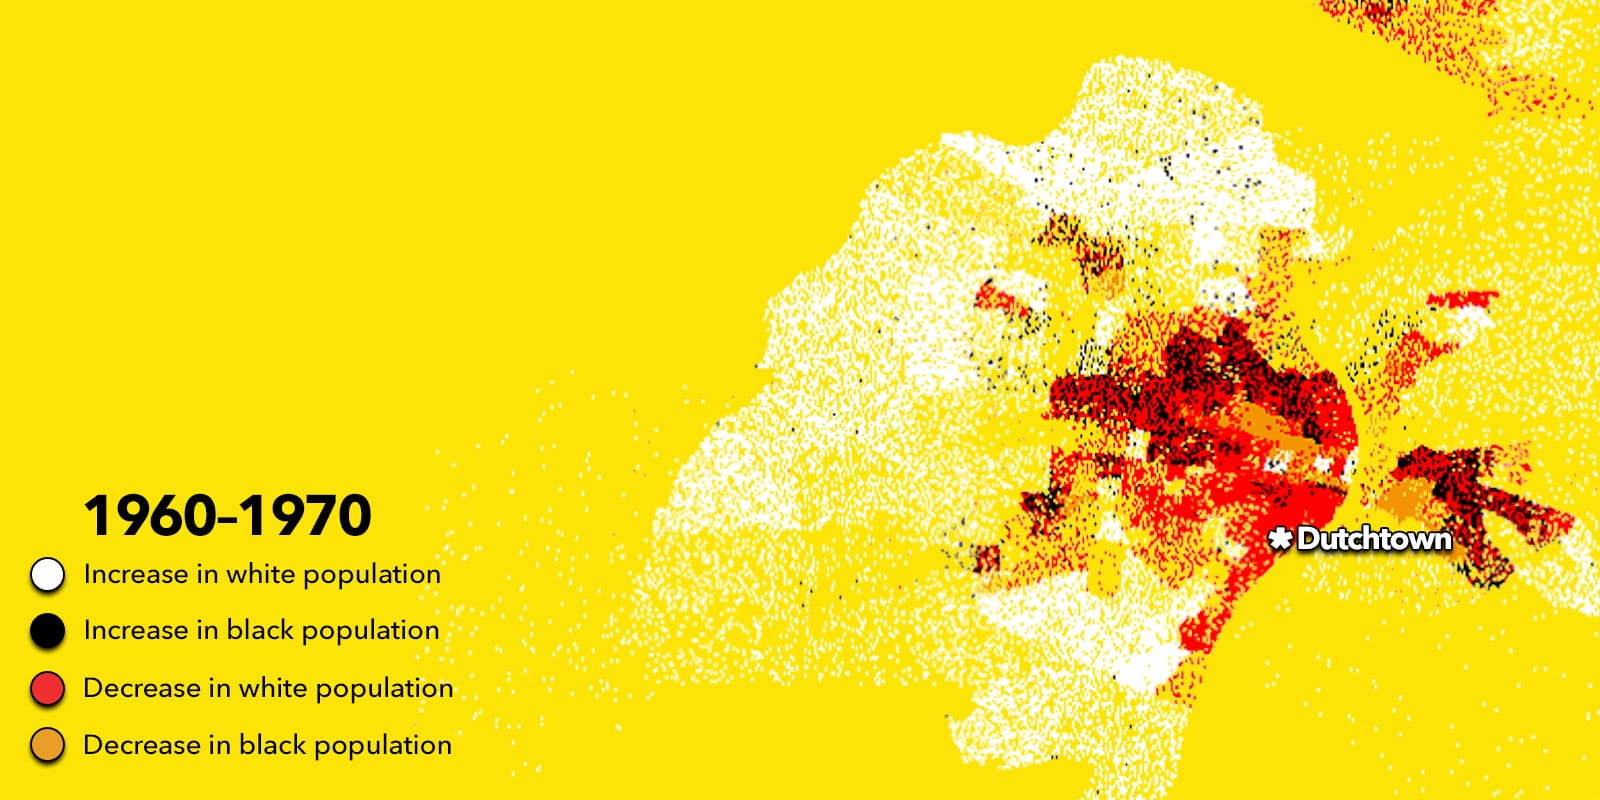
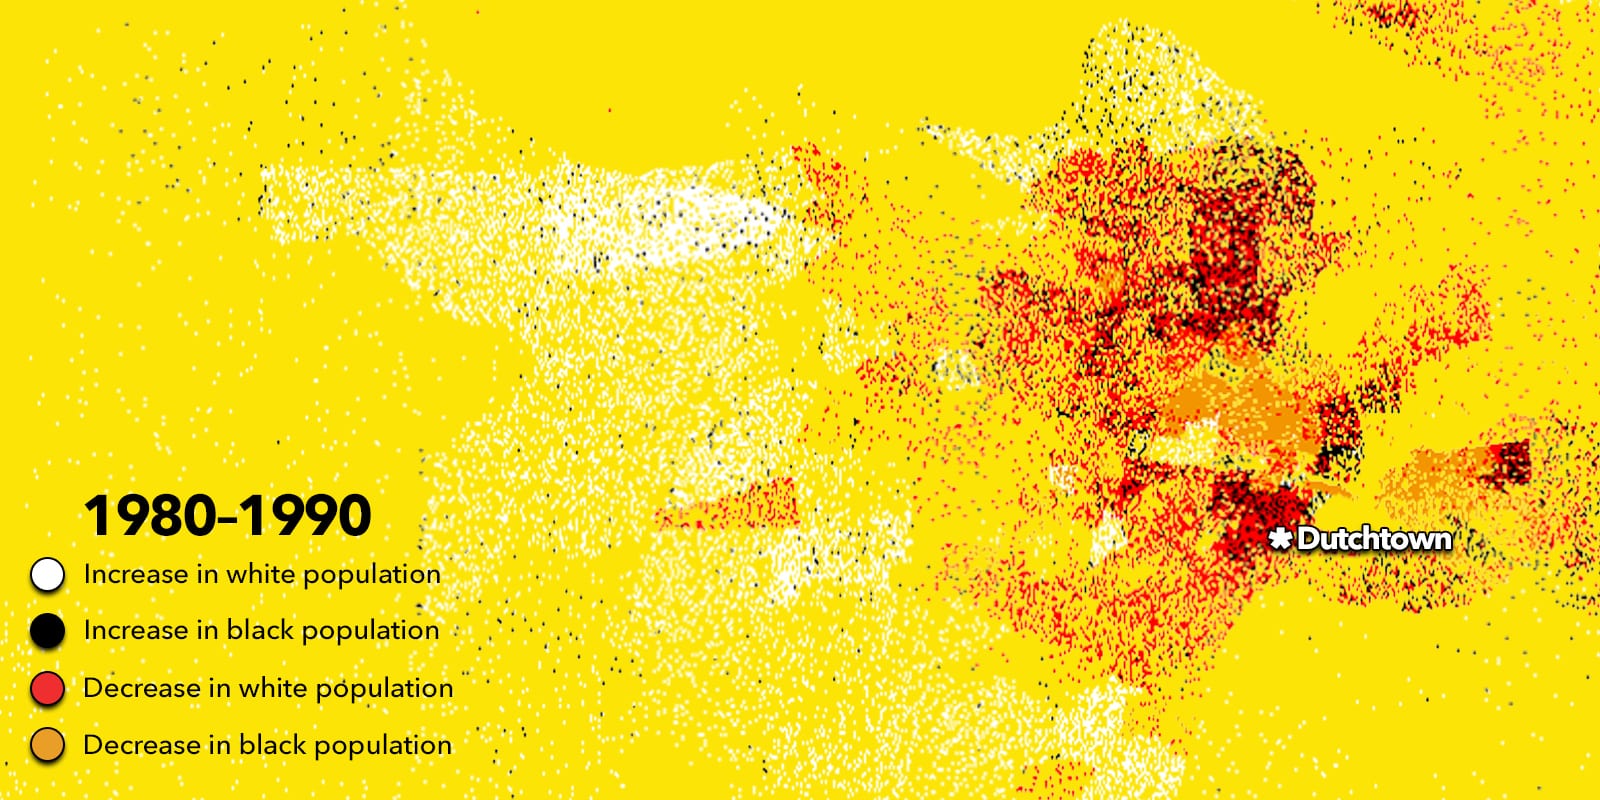
The South Side had been solidly white for most of its history, but in the 1970s and 1980s, Blacks began to move into neighborhoods on the near South Side, partially filling the vacuum as whites continued to move to the ever-expanding suburbs.
Further south, Dutchtown remained overwhelmingly populated by Whites. In 1980, of the approximately 18,000 residents of Dutchtown proper, only about 100 were Black. Some say that Chippewa Street was the dividing line where Black intracity migration was halted.
Turn of the Millennium: Change Brings Stability
The 1990s and 2000s brought the demographic shifts seen elsewhere on the South Side to Dutchtown. As some areas of the near South Side began to redevelop and gentrify, those displaced residents found themselves in Dutchtown’s affordable, sturdy, and dense housing stock.
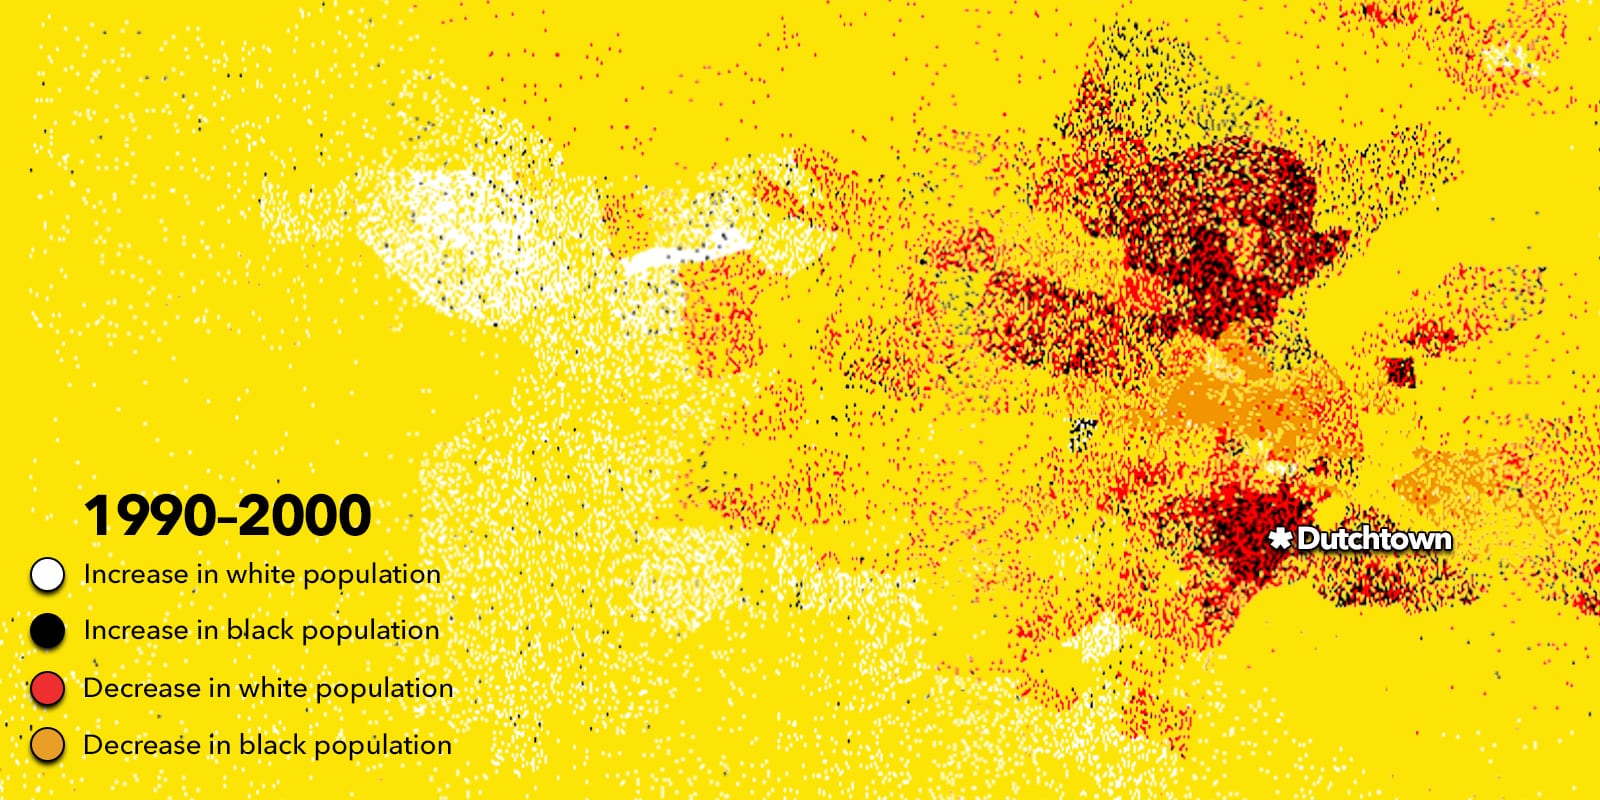
Between 1990 and 2010, Dutchtown shifted from 90% White to a nearly equal proportion of Blacks and Whites. People of color now make up a majority of Dutchtown’s population.
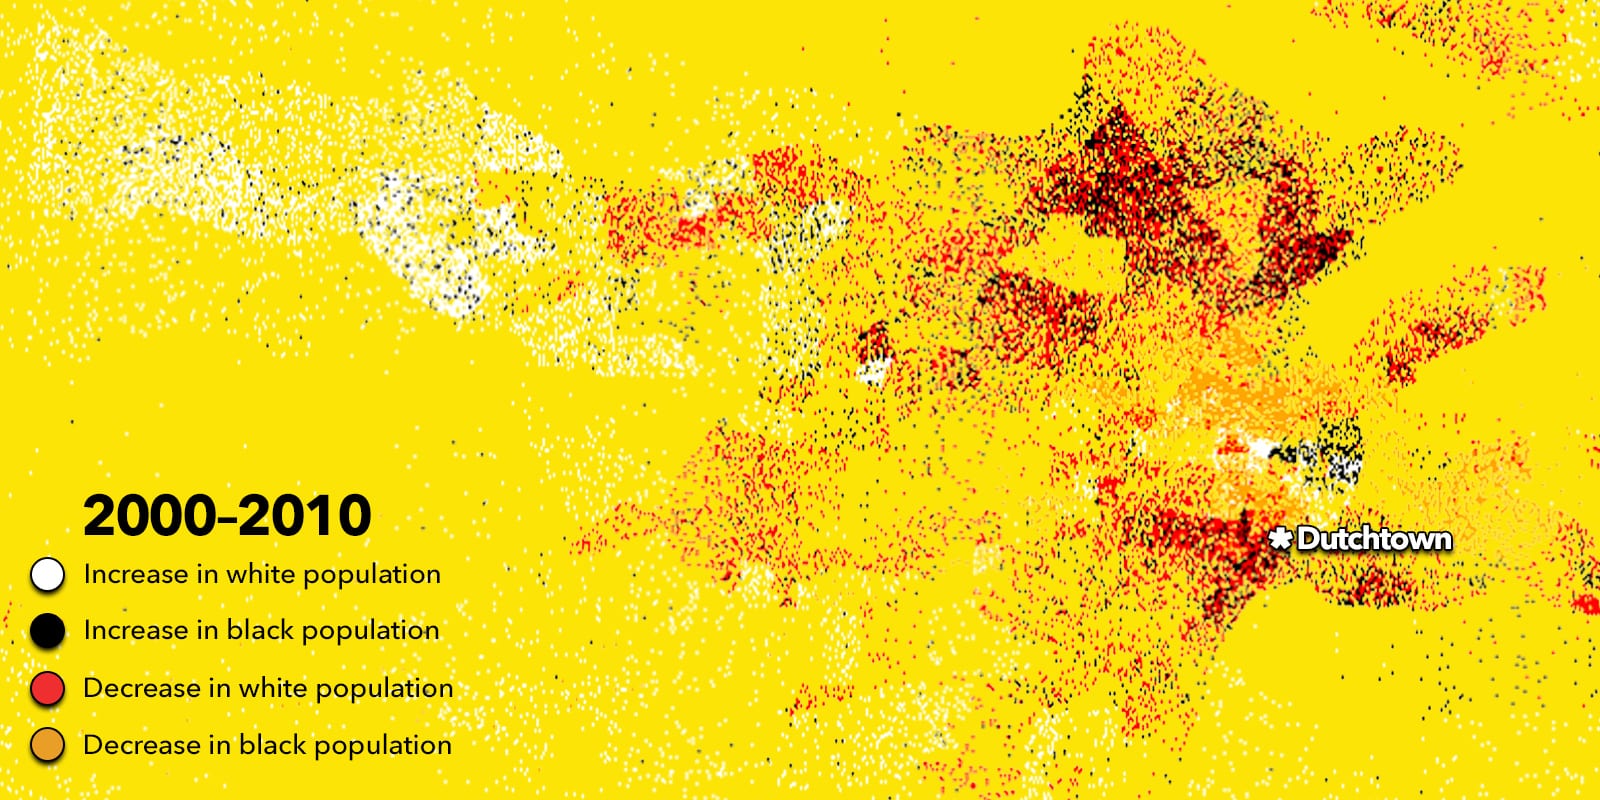
The influx of Black people, along with immigrants from across the globe, has helped to stabilize Dutchtown’s population compared with the rest of the city. St. Louis as a whole lost two-thirds of its residents from a peak population of nearly a million people in the 1950s.
While neighborhoods like Forest Park Southeast and Shaw hemorrhaged residents, showing population declines of nearly 70% since the 1950s, Dutchtown proper lost only about a third of its population since 1950. This population stability has helped stave off the abandonment, amongst other issues, that has been seen in other city neighborhoods.
Although FPSE and Shaw have seen significant revitalization in recent years, that new development is far less dense than what was once there. Meanwhile, Dutchtown remains one of the most densely populated areas in St. Louis, housing approximately 10,000 residents per square mile.
Strength in Diversity
A diverse and dynamic population has emerged from what was originally predominantly German immigrants. Dutchtown remains a place where neighbors come together to live, pray, study, work, shop, and connect.
Diversity is one of Dutchtown’s many strengths. With community engagement, effort, and strategic partnerships, we can build a thriving, equitable, inclusive neighborhood together.
Notes
Some data used refers to the Dutchtown neighborhood as specifically defined by the City of St. Louis, and other data refers to the Greater Dutchtown area. Trends are generally consistent in both cases, but numbers can be significantly different. Any data experts that want to help make our data more consistent are more than welcome to contact us!
Greater Dutchtown population numbers are derived from census tracts that cover significant portions of Dutchtown, Gravois Park, Marine Villa, and Mount Pleasant, but in some cases go outside of those boundaries. The tracts included are 1153–1157, 1163.02 and 1164, 1241, 1243, and 1246. Prior to 1990, tract 1163.02 was part of a larger tract, 1163, that covered area mostly outside of the greater Dutchtown area; as such, pre-1990 total population figures are slightly inflated.